With interfacial rheology the viscoelastic behavior and stress relaxation of an interface can be characterized. For simple systems like e.g. water and air the behavior is quite trivial, as the surface tension (interfacial tension between liquid and gas) stays constant and is independent of the changing area. The situation differs dramatically once interfacially active components like surfactants, polymers, nanoparticles etc. are present in one of the phases.
Interfacially active components adsorb and form a layer at the interface. In equilibrium the molecules or particles occupy a certain amount of space at the interface and have a mean distance from each other. The resulting equilibrium interfacial concentration c0 is characteristic of the system and depends on parameters like the participating phases, the interfacially active component and its bulk concentration. When the available interfacial area changes by e.g. changing the volume of a drop or by moving barriers across the interface the interfacially active components react to the deflection out of the equilibrium state.
When the interfacial area is decreased, the interfacial concentration increases, and the system tries to reach its equilibrium by desorbing the active components from the interface. When the interfacial area is increased, the interfacial concentration decreases and the equilibrium state is restored by adsorbing active components (see figure 1).
Since the interfacial concentration of active components changes the interfacial tension between the phases changes accordingly. For example, when the surfactant concentration at the interface increases by decreasing the available area, the interfacial tension will decrease as well. And if the area is being increased so does the interfacial tension. The reaction by the interfacially active components can occur at different speeds. This can depend on various factors like e.g. the mobility of the components inside the bulk phase, the bulk concentration and the interfacial energy between the phases.
The interfacial behavior can be described by the complex viscoelastic modulus E*. It consists of an elastic part E′ and a viscous part E″.

The complex viscoelastic modulus can be measured by continuously decreasing and increasing the interfacial area in an oscillatory manner. When the interfacial area is changed sinusoidally the interfacial tension also changes sinusoidally. The two sine waves are shifted by the phase shift 𝜑 (see figure 2). The phase shift depends on the reaction speed of the interfacially active components. The faster the interfacially active components react by adsorbing and desorbing to the interface the larger the phase shift becomes.
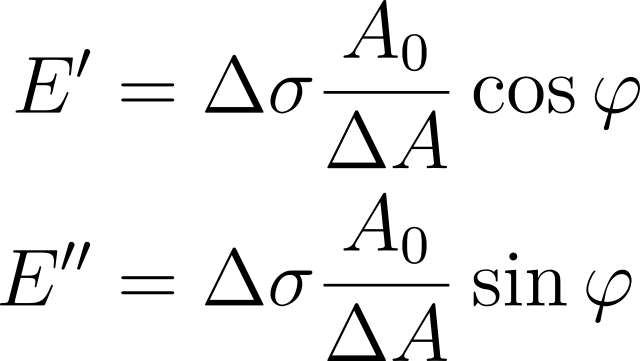
The elastic modulus E′ and the viscous modulus E″ can be calculated from the sinusoidal area and tension change:

Where Δσ and ΔA are the peak-to-peak amplitudes of the interfacial tension and interfacial area, A0 is the mean interfacial area and 𝜑 is the phase shift.
Measuring the elastic and viscous modulus can help the development of interfacially active components and answer questions like how well can a newly generated emulsion stabilize?
.
DataPhysics Instruments offers multiple systems that enable the measurement of the viscoelastic modulus. With an optical contact angle goniometer and drop shape analysis system of the OCA series and corresponding accessories, oscillating pendant drops can be created (see also figure 2). Using a spinning drop video tensiometer of the SVT series the rotational velocity of a spinning drop can be oscillated or using a dynamic contact angle measuring device and force tensiometer of the DCAT series the position of the barriers of a Langmuir through can be oscillated. Once the viscoelastic behavior has been optimized the influence on the stability of an emulsion can be analyzed with a MultiScan dispersion stability analysis system.